Most Wonderful Time of the Year

Just a quick reminder and refresher (though it’s a few days late)…

The vernal equinox just passed, which means, not only does everyone in the northern hemisphere have at least 12 hours of daylight, but the days are getting longer faster than at any other time of the year.

Combined with Daylight Savings Time, that means we are getting finally getting some bright evenings at northern latitudes (if not warmer temperatures).  So enjoy!

And to our neighbors at the bottom of the map… sorry.  You have to wait six months for a similar thrill!

Piano Strings

There’s nothing remarkable about it. All one has to do is hit the right keys at the right time and the instrument plays itself
Johann Sebastian Bach

I found myself recently staring down into a baby grand piano recently, and for the first time I considered the motivation for its exterior curves.  Noting the varying lengths of the piano wires for the different notes, I naturally assumed that their arrangement dictated the piano’s shape.  A little physics, as well as piano history set me straight.

First off, I used Wikipedia to refresh my memory on how to calculate the fundamental harmonics of strings, which after a little rearranging, allows me to calculate a piano string/wire’s length:

L=\frac{1}{2f}\sqrt{\frac{T}{\mu}}

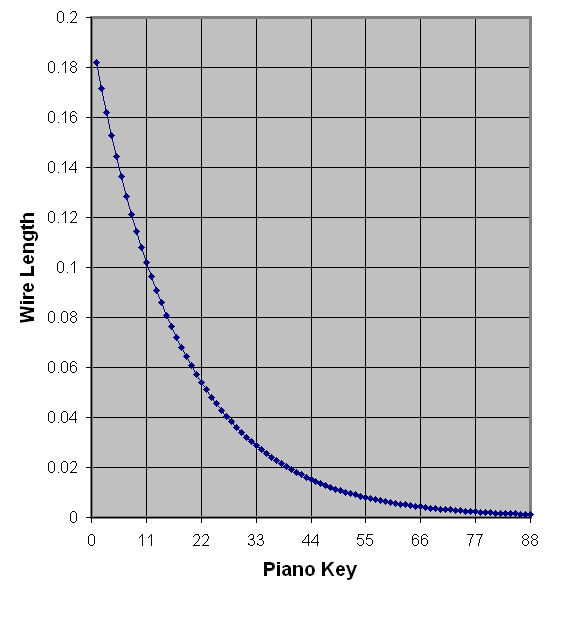
So, for a given tension, T, and linear density, \mu, the length of a wire is inversely proportional to its frequency.  That rings a bell; now if we (incorrectly) assume all of wires have the same tension and linear density, we can reconstruct the trend of the wire lengths as a function of piano keys, once we know the frequency of the keys:

Note that since the values I used for tension and linear density are arbitrary, the units of length are unimportant, just their relative magnitudes.

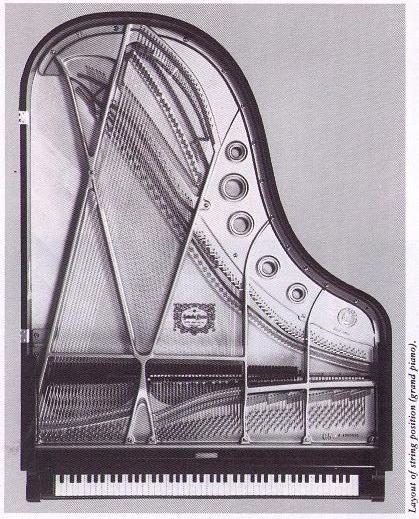
Now compare to the inside of a piano:

Not bad, right?  Of course, there are some important differences that should be noted.  First, the piano strings are in fact not of constant linear density or tension.  Apparently, the linear density changes throughout the piano; I read somewhere that approximately every sixth string the wire gauge changes.  The tension is obviously varied in order to get precise tuning.  And the lower notes on the left hand side are rearranged completely differently, significantly changing the shape of that end of the piano.  According to this article on piano history:

Overstringing was invented by Jean Henri Pap during the 1820’s and was first patented for use in grand pianos in the United States by Henry Steinway, Jr. in 1859. When overstringing a piano, the strings are placed in a vertically overlapping slanted arrangement, with two heights of bridges on the soundboard instead of just one. This allowed for larger strings to fit within the piano case.

So to avoid the long tapering spike at the lowest notes, it appears that as a matter of convenience, they are angled to help improve the overall footprint of the piano.  I imagine their linear density is also significantly larger than the higher notes in order to reduce their length.

While I was dubious about it to begin with, it appears that in fact, there’s no justification for the inflection point that a typical piano has in it’s exterior.  It’s simply an artifact of the arrangement of the lower notes, and probably aesthetics.

Vanishing Head

I don’t know if you’ve ever played the game where you hold an outstretched hand and pretend to squeeze people and objects in the distance between your thumb and forefinger.  Well, there’s another way you can make-believe cause someone’s head to disappear.  Now I don’t really want to be the type of blog that just regurgitates other posts from around the web, but I suppose I’ll make the occasional exception for exceptionally neat things.  Check it out:


I already knew about the blind spot; it was something to think about paying attention to while star-gazing.  Sky and Telescope relates it with a little more precision:

As it turns out, your eye is most sensitive to a faint object when that object lies 8° to 16° from the center of vision in the direction of your nose. Almost as good a position is 6° to 12° above your center of view. Avoid placing the object very far on the “ear side” of your center of vision; it may fall on the retina’s blind spot there and vanish altogether.

Sure enough, the YouTube video utilizes the blind spot on the “ear-side”, of your left eye.  I guess I also knew that your brain compensates for it, because it’s not as if you’re conscious of a gaping hole in your vision.  But I was quite surprised that it was sophisticated enough to complete the black bar swept through the blind spot, preserving its continuity.

Wikipedia shared another neat fact; the octopus and other cephalopods do not suffer from blind spots; their optic nerves travel behind the receptors, and so they do not form a bundle in front of the retina.

Feynman Sprinkler

Perhaps you have heard of the Feynman Sprinkler before; it’s a relatively famous physics conceit, though admittedly, physics mind-benders are not necessarily part of the public consciousness.  Feynman himself was particularly coy when writing about it in his autobiography, abstaining from sharing the result of his experiment, which has led to the typical internet speculation (see: airplane on a treadmill).  It’s such a neat problem because smart, informed people can come to completely different conclusions as to what happens when you run a sprinkler in reverse.

   
Normal Sprinkler Feynman Sprinkler

Obviously, our “normal” sprinkler will spin clockwise.  Feynman wanted to know what direction it would spin when run in reverse.  I think there’s a general consensus that an underwater sprinkler, when run in reverse will not spin, but why?  I’ve heard various explanations that are either confusing, misleading, or wrong, so I wanted to tackle it myself.

What’s the big problem anyway?  Why is this so hard to wrap your head around?  I think the core of the confusion is that we have a problem which appears to be symmetric, and in physics, we expect symmetric situations to behave symmetrically.  But, in fact, the symmetry is an illusion.  Why?  We’ll get to that…

First, I’d like to begin the analysis with our trusty friend, the control volume.  Again, we have to be careful; this analysis has given me considerable trouble due to silly assumptions that I’m used to making, but cannot be made here.

All right, first let’s start with the easier case: that of a sprinkler running in the “correct” direction underwater.  To simplify the problem, we will assume the sprinkler is not moving or accelerating or anything.  Speaking of symmetry, we’re going to use it here, and only examine half of our sprinkler:

Here’s a cross-section of the sprinkler; so let’s set up a control volume around the outside of the sprinkler pipe, across the entrance and exit.  Here’s our scary-looking equation:

\sum\left( \vec{r} \times\vec{F}\right)_{tot}=\frac{\partial}{\partial t}\int_{cv}\left( \vec{r} \times\vec{V}\right) \rho dV+\int_{cs}\left( \vec{r} \times\vec{V}\right) \rho\vec{V}\cdot \hat{n}dA

Okay, let’s start rocking the terms.  Since we only care about the static state, we can drop the time-dependent term:

\sum\left( \vec{r} \times\vec{F}\right)_{tot}=\int_{cs}\left( \vec{r} \times\vec{V}\right) \rho\vec{V}\cdot \hat{n}dA

Because I’ve set up the problem so elegantly, everything happens at right angles and the cross products can simplify so that we are simply balancing torques perpendicular to the page:

\tau_{tot}=\rho A_{in}RV^{2}=\rho QRV=\dot{m}RV

The first term is equivalent to the total torque being applied to the control volume, while the second term comes from evaluating the integral for the flow out of the nozzle (top of the diagram). This is the only flow in our problem happening at any distance from the pivot point.  The inflow is occurring at the axis of rotation and so it doesn’t contribute anything to the fluid’s angular momentum about that point.

Our job is now to equate the total torque with the torques on the control volume’s surface.  Anything left over must be due to the external torque needed to keep the sprinkler still while water is flowing through it.

\vec{\tau}_{tot}=\vec{\tau}_{surf}+\vec{\tau}_{ext}

Generally, the torque is calculated by integrating \vec{r}\times\vec{F} over the control surface, where \vec{F} is determined by p\hat{n}dA.  It so happens for this type of finite control volume analysis, it works best to assume that the nominal fluid pressure is zero.  This “gauge” pressure can be set arbitrarily without affecting our results, so for convenience (and to reduce the number of integrals we have to do), we will set it to zero, and fluid pressures will all be relative to this.  That is, all of the surrounding, unmoving fluid in the problem will have a pressure of zero.  Furthermore, in fluid mechanics, a “free jet” such as the one we have here, has a pressure equivalent to the surrounding fluid (that is, zero).

Soooo…. that means the pressure, and therefore the force all around the control volume is zero; which means \tau_{tot}=\tau_{ext} and we have

\tau_{ext}=\dot{m}RV

So the torque required to keep the nozzle in place is \dot{m}RV (positive, out of the page).  Another way to look at it is that this half of the nozzle apparatus (everything in the control volume) is exerting a torque of -\dot{m}RV on the hub, or whatever is holding it in place.  Doing the same analysis on the other half would yield the same result, with the additive, total torque required to keep the sprinkler still equal to 2\dot{m}RV.

Have I lost you yet?

Okay, then; let’s keep going.

Here we have the case of the reverse (Feynman) sprinkler.  It seems like a straight-forward process to redo the calculations, but with opposite flow conditions, but unfortunately some of our more essential assumptions break down.  I think this is what creates confusion — a lack of symmetry in the flow.

A low-hanging fruit is that the pressure of the inflow is not equivalent to ambient in the reverse case.  This can be worked out using the Bernoulli equation to determine pressure as a function of velocity, where along a streamline, (specific) energy is conserved:

\tfrac{1}{2}\rho V^2_1+\rho g z_1 + p_1=\tfrac{1}{2}\rho V^2_2+\rho g z_2 + p_2

Since the  fluid is being accelerated from the quiescent surroundings (which are at zero pressure), and change in elevation is negligible, the equation becomes:

0=\tfrac{1}{2}\rho V^2_2 + p_2
p_2 =-\tfrac{1}{2}\rho V^2_2=\tfrac{1}{2A_{noz}}\rho Q V_2

All right, I haven’t been entirely upfront with you.  This is not a great application of the Bernoulli equation.

Where did we/I go wrong?

My cartoons have not been doing the flow field justice.  The velocities at the exit probably look closer to this (regular sprinkler on the left, reverse sprinkler on the right):

Another illustration of the non-intuitive asymmetry of the problem

The outflow velocities can more or less be considered to be parallel, and have an either laminar or turbulent profile, resulting in our expression for torque being mostly unchanged.  However, I don’t have any good analytic expression for the velocity profile coming in, making our control volume analysis exceedingly difficult (I know there’s a vena contracta and separated flow as the fluid enters the nozzle).  Since we’re assuming the mass flow rates are the same, though, I’ll take a leap of faith and say that right hand side of the control volume equation is the same in both cases (the velocity is the opposite direction, but the sign stays the same because it is squared).

But let’s use our new information to do a better job with the Bernoulli equation.  When streamlines are bent so severely, some of the Bernoulli assumptions about conserved energy (inviscid-ness) are violated.  This energy loss can be accounted for by introducing a head loss term:

\tfrac{1}{2}\rho V^2_1+\rho g z_1 + p_1=\tfrac{1}{2}\rho V^2_2+\rho g z_2 + p_2+h_L

where

h_L=\tfrac{1}{2}K_L \rho V^2

What of this K_L?  It is a loss coefficient that is a function of the geometry of the loss feature; in our case the nozzle entrance.  Similar “re-entrant” pipes tend to have very high coefficients, approaching the maximum of unity.  Supposing it is unity, let’s recalculate the pressure p_2:

0=\tfrac{1}{2}\rho V^2_2 + p_2+h_L=\tfrac{1}{2}\rho V^2_2 + p_2+\tfrac{1}{2}\rho V^2_2
p_2=\rho V^2_2=\frac{\rho Q V_2}{A_{noz}}

I’m sick of caveats, but here’s another one.  The pressure is not uniform across the entrance, nor do the losses happen at the entrance.  The pressure drop actually occurs due to viscous effects in the separated flow along the entrance of the pipe; but since we’re assuming inviscid flow, this is the correction we need to apply to the upstream pressure (at the entrance) to overcome these viscous losses.

We can then determine the torque from surface forces:

T_{surf}=R p A_{noz}
T_{surf}=R \rho Q V
T_{surf}=\dot{m}RV

And now to work it in to our full control volume equation:

T_{tot}=T_{ext}+T_{surf}=\int_{cs}\left( \vec{r} \times\vec{V}\right) \rho\vec{V}\cdot \hat{n}dA
T_{ext}+\dot{m}RV=\dot{m}RV
T_{ext}=0

So that means there are no outside torques needed to keep the nozzle in place; in other words, the nozzle is not going to spin even if we don’t hold it.

Do I have you convinced?!

Although Feynman never revealed “the answer” or what happened when he tested it out in the lab, the general consensus is that there is no torque on the reverse sprinkler.  However, knowing the answer definitely helped me get here, and I’m not sure that I can be totally confident in my assumptions.  That being said, the flow profile, and therefore the analytical solution, is pretty messy in the reverse case, and requires some bold assumptions to make the problem tractable.  Even if this explanation is not a concrete proof, I hope it helps align the math of the problem with experimental results.  It certainly helped me rationalize the phenomenon.

Toilet Bomb

There’s a lot of sexy data we’ve got going here.
Tori Bellaci

Sorry for the long absence, but science conference season is behind me, and the Mythbusters are doing science!  I thought the Mythbusters did an admirable job of actually trying to explain the science of the fluid dynamics regarding the benefit of flying in the V-formation.  Talking to people who knew what they were talking about definitely helped.

wingtip vortex

Thanks NASA!

I won’t harp on it, because, surprise, surprise, Wikipedia does a really good job of explaining it, but something they don’t spend much time on is the effect of the trailing vorticies on the plane (or bird) generating them.  Seeing as the wingtip vortex is creating an upwash (utilized by the trailing aircraft), it is obvious that if the plane is driving air up at the tip, a corresponding negative lift is acting on the wing (as well as increased drag).  This is obviously not beneficial to flight, nor are the powerful, and stable vorticies that can persist for a long time and disrupt other planes’ flight (esp. smaller ones).

While they can’t be eliminated completely in a three-dimensional world lacking infinite wingspans, aircraft manufacturers have devised some strategies for limiting the effect.  The most noticeable, perhaps, is the winglet, which decreases the pressure difference on either side of the airfoil, by making that edge vertical.

As usual, the Mythbusters’ data logging was less than extensive/thorough, though.  I would have really like to see them use the smoke generators on the plane close to the wing tips to visualize the vorticies.  I’m not sure if it is even possible to do this; maybe you’d have to line up a plane’s wingtip behind another’s smoke trail.  But besides being cool, it would have let the trailing planes know where they needed to be in order to exploit the vortex in whatever formation they were flying.

The toilet stuff was cool; I have also had problems with batteries under-performing under cold conditions…

Aerodynamics Meets Art

I love when art and physics demonstrations collide!

When I was in Paris recently, I stayed very close to the Pompidou and was fortunate enough to see this “kinetic sculpture” titled “Flux” by Zilvinas Kempinas.  Basically, by pointing a fan down at table, he is able to suspend a loop of magnetic tape pretty much indefinitely.


I’d love to break down in greater detail how this works someday. I have a feeling it’s sort of the opposite of the more recognizable, equally cool phenomenon of suspending a ping pong ball with a vertical air jet.  In that case, Bernoulli’s principle explains that when air is flowing around the ping pong ball, if the ball shifts slightly outside the center of the air stream, the faster moving air in the center of the jet “sucks” the ball back in to the middle.

The tape is remarkable in that is suspended and relatively stable (it doesn’t drift off).  As the air deflects back up and away from the table, it pushes the tape up against gravity just as is the case with the ping pong ball. But I believe what keeps the magnetic tape centered has less to do with Bernoulli and more to do with drag.  As the jet spreads out away from the centerline, its speed decay.  In this way, when a segment of the tape gets “too far” from the centerline, the push it’s getting from the jet decreases.  When it gets too close to the center, the velocity is greater, so the drag is greater, pushing the tape more towards the periphery.

I dug around YouTube a bit for more Kempinas and found other cool magnetic tape fun:

And another!

I’d love to come up with something this cool someday; I love when science is art is science. My particular aspiration would involve fun with fountains!

Bikes and Bazookas

More surface area, but it’s smoother.
Jamie Hyneman

Ba-ZOO-ka.

It’s fun to say!

Last week (with the walking in a straight line) was great, but there wasn’t a lot for me to break down, science-style.  So I went back to the archives and dug up this beauty which aired recently while I was out of town.  I’d like to concentrate on the bike part of the myth for now.  Although, perhaps, they don’t have the technical background or terminology to exactly describe it, Adam and Jamie have a good feel with the major source of drag with an upright bicyclists.

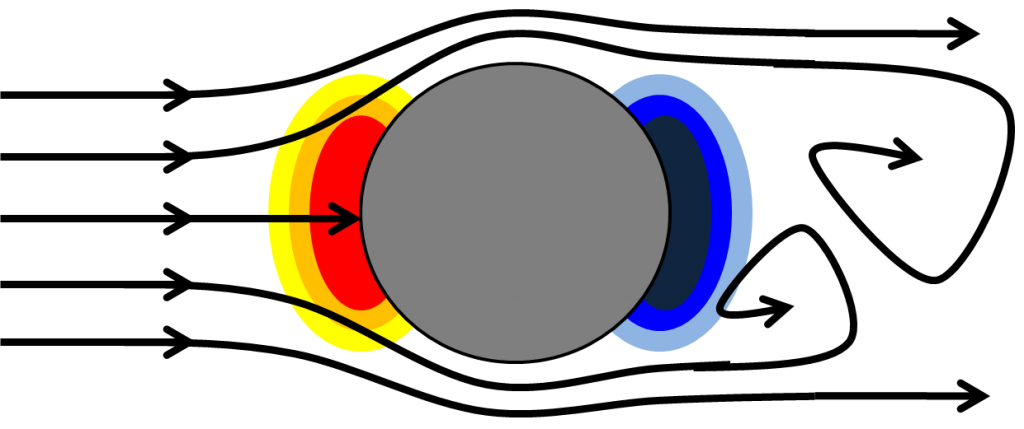
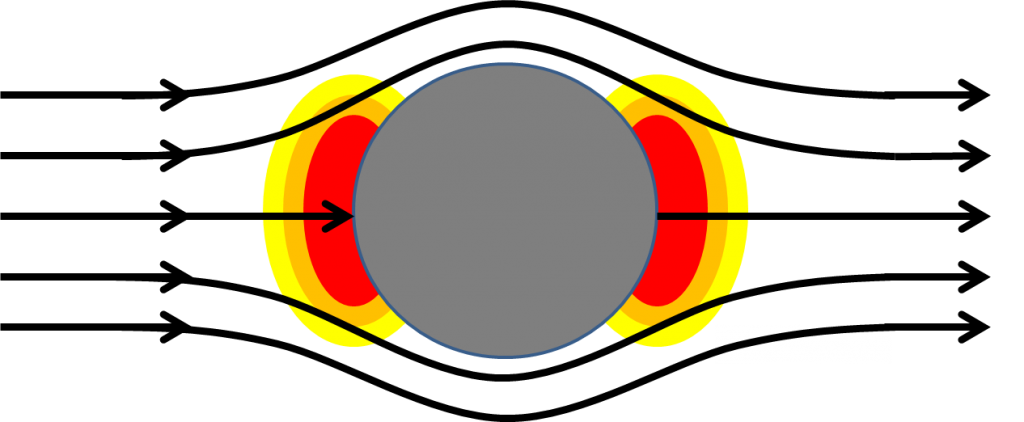
In general, there are two types of aerodynamic drag.  One, called pressure drag is probably the intuitive kind that you’d typically think of when considering aerodynamic drag.  You can think of it as happening when an object is moving so quick through a fluid (gas or liquid), that the fluid doesn’t have the ability to fill in behind the object as it passed by.  Thus, a high pressure builds up on the front of the object and a low pressure on the backside.  This pressure differential integrates across the surface of the body to produce a net force resisting the object’s movement (to the right in the image below).

However, sometimes an object travels relatively slowly through a fluid, such that the fluid can recover and flow smoothly around the object’s backside (fluid dynamicists quantify this relative velocity with the Reynolds number).  When this is the case (that is, the object is “streamlined” for the relevant Reynolds number), pressure drag can actually contribute very little to the drag force.  Friction drag will become the dominant drag force, which is a function of the velocity of the object through the fluid, the viscosity of the fluid, and the surface area of the object.

I bold for emphasis, because in the case of the bike, Adam and Jamie keep the first two quantities constant and tweak the last one; that is, the motorcycle travels the same speed, through air, but now the geometry has mostly eliminated pressure drag, but greatly increased friction drag by increasing the surface area of the object.

from Wikipedia

Engineers account for the two types of drag when calculating/measuring an object’s drag coefficient.  While it may be intuitive to shape a body aerodynamically, making it “streamlined”, there is quite a bit of information about how easily basic shapes travel through the air.  Sure enough, Adam and Jamie’s teardrop shape ranks quite low on this list of drag coefficients from Wikipedia.

These drag coefficients (C_d) are used to predict the drag force experienced by an object with frontal area at a particular fluid density and speed:

F_d=\tfrac{1}{2}C_d \rho v^2 A

Of course, nothing can be so simple as that, and as it turns out, C_d varies in a very non-linear way as a function of Reynolds number; in fact, at the very low Reynolds numbers where frictional drag dominates, it varies linearly with the Reynolds number.

I know that was kind of a lot to digest, so please feel free to continue the discussion in the comments!

Temperature at Altitude

Atmospheric Layers

from Wikipedia

I recently partook in some international travel, which is also not a small reason why there hasn’t been a post in a while.  Curious thing about the rest of the world: they tend to uniformly use a system of units that’s widely regarded as superior to the set we use in the U.S. of A, handed down to us by our imperial fore-fathers.

Despite my general affinity for the SI system of units, I do have a soft spot for the Fahrenheit degree, seeing as how Celsius degrees are not, strictly speaking, SI, and Fahrenheit gives about twice the resolution of the Kelvin, allowing us to complain about the weather more precisely.

During my international flight, they give you a little display option to see your altitude and outside temperature; because I didn’t want to turn off my showing of X-Men: First Class, I peeked over at a neighbor’s monitor and saw that when we had climbed to an altitude of 10,000 meters, the outside temperature read the same value for Fahrenheit AND Celsius!

When would we expect that to happen?  There’s actually a pretty straight-forward equation for converting Fahrenheit to Celsius (if I sound surprised, it’s because so many thermodynamic quantities are not so easy to quantify):

T_{ \textdegree F} =\frac{9}{5} T_{ \textdegree C}+32 \textdegree F
note, the 9/5 technically has units of \textdegree F per \textdegree C

Always do a couple quick sanity checks when you get a new equation like this, which describes something you’re somewhat familiar with (also to check that I didn’t make a mistake).  Let’s check the freezing and boiling points of water.  Freezing is at zero Celsius, times 9/5, plus 32 comes out to 32 degrees F.  Okay, so far so good.  What about boiling?  100 degrees C times 9/5 is 180 plus 32 is 212 Fahrenheit.  Right.  Okay, so when will the two temperatures be the same?

Let’s substitute T_{\textdegree F} for T_{\textdegree C}:

T_{ \textdegree F} =\frac{9}{5} T_{ \textdegree F}+32 \textdegree F

Solving for T_{\textdegree F}:

-\frac{4}{5} T_{ \textdegree F} = 32 \textdegree F
T_{ \textdegree F} = -40 \textdegree F= T_{ \textdegree C}

Sure enough, the monitor showed -40 for both temperature units.  Does this make sense, based on our altitude?  I wasn’t sure at the time, but as it turns out, 10 km is towards the top of the troposphere, near the tropopause.  I was hoping to be able to calculate temperature as a function of altitude very accurately for comparison, but it turns out that while the temperature decreases fairly linearly with altitude, the “environmental lapse rate” is a function of latitude and atmospheric composition.  But, by and large, -40 degrees (Celsius or Fahrenheit) seems to be perfectly reasonable.

Joulies

I am so mad right now.  I was pointed to this website by someone who knows I like my coffee less than scalding:

http://www.joulies.com/

I am not mad at Dave or Dave, but at myself.  I’m an engineer.  I hate “too hot” coffee and am not enthralled by cold coffee.  I know about thermodynamics.  And yet, did it occur to me to do something like this?  No.  I’d like to think I look for problems and solutions, but I completely whiffed on this.  I blame my god-given lack of inspiration, creativity and entrepreneurship.

What do these do and how do they do it?

Well, in a perfect world, our coffee maintains a constant (hot) temperature for as long as we care to drink it.  A Goldilocks temperature.  Not too hot, not too cold.  However, according to thermodynamics, thermal energy moves from high to low temperatures.  That is, assuming you’re not drinking your coffee in a very hot sauna, it will relentlessly transfer heat to your surroundings (via radiation, convection, and conduction) until it has assumed the same temperature as its surroundings.

There is a small caveat to this; at the point of a phase change, the temperature of a substance will remain the same even as it transfers heat.  For example, a well-mixed glass of ice water at a uniform temperature of zero degrees Celsius will absorb heat while remaining at zero degrees until all the ice is melted.  So H2O can be zero degrees as a liquid and a solid; the liquid phase just contains far more heat energy than the ice phase.

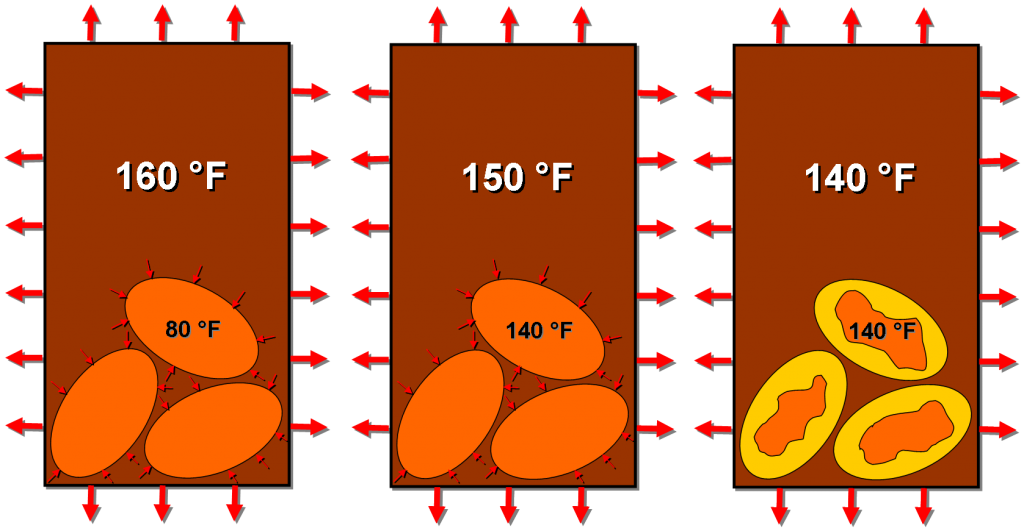
Knowing the temperature they consider ideal (say 140 F), our friends Dave and Dave exploited this phase change property to maintain a temperature for as long as the mug can inhibit heat loss.  They impregnated each Joulie with a material that changes phase from solid to liquid at 140 F.

Adding too-hot coffee to the mug will heat up the Joulies to 140 F at which point they will start to melt (absorbing heat all the time).  Assuming you’ve used enough Joulies in your coffee, the insides shouldn’t quite melt all the way before cooling the coffee off to 140 F (or else the coffee would “cool” to some temperature above 140 F).  At this instant, when the coffee is the same temperature as the melting point of the interior of the Joulies, there will be no heat transfer between the two.

Oh yeah, added bonus!  Because heat transfer depends on the difference in temperature, by initially cooling the coffee to a drinkable temperature, the Joulies actually reduce the initial degree of heat loss to the surrounding environment!

Heat is absorbed by the Joulies (causing the orange solid phase to melt into the gold liquid phase) until the coffee and Joulies are the same temperature

Our Goldilocks temperature coffee, however, will continue to lose heat to the environment.  But, once the Joulies equilibrate with the coffee at 140 F, they will maintain that temperature as they release heat into the coffee (due to the liquidy bits solidifying).

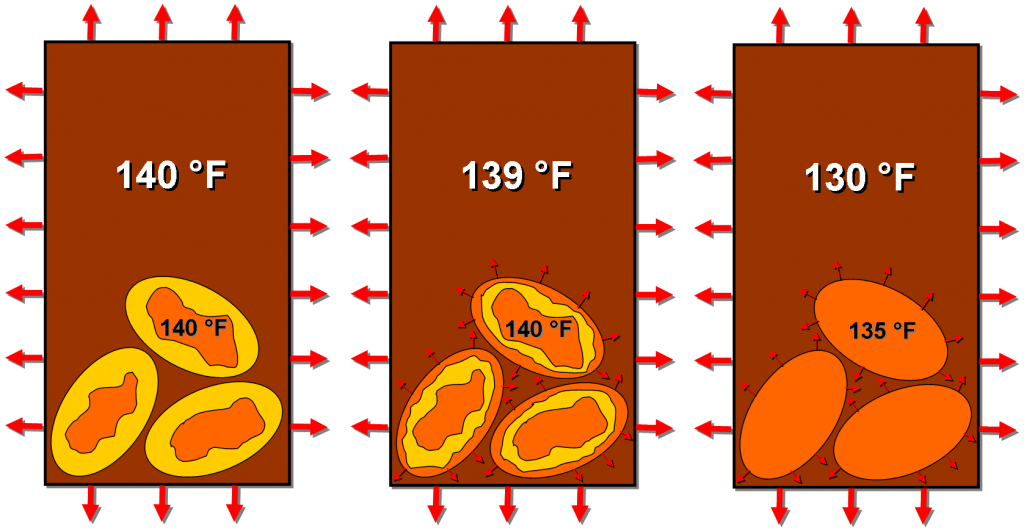
NOTE: Just to make a point about heat transfer moving from high to low temperatures, I show the coffee as 139 F; it can actually be infinitely close to 140 F, it just has to be a smidgen lower than the Joulies in order to permit heat transfer.  The actual temperature difference and uniformity will depend on harder to quantify things, like the degree of mixing in the coffee and the heat transfer coefficients between all of our materials.

Once the internals of the Joulies have completely solidified, they can now cool off to temperatures below 140 F, and so, of course, will the coffee until it reaches temperatures more appropriate for a hot tub than for drinking.  But this unfortunate, inevitable conclusion will be greatly delayed, allowing a longer window to enjoy your tasty beverage!

Once the internals have melted and assumed the same temperature as the coffee, the Joulies can release stored heat back into the coffee, maintaining a more or less constant temperature

So again, kudos to Dave and Dave.  Finding a simple, robust solution to an actual (if not life-and-death) problem.  This is engineering at its best.

Time Keeps on Slipping into the Future

Summer’s end is drawing near, and that always leaves me a little bummed out.  It’s not the temperatures I fear, it’s the waning daylight that really irks me.  Obviously, at higher latitudes, summer days are quite long, but in an example of conservation of daylight, I guess, you pay for it with very short winter days.  People on the equator should be more well-balanced, as they enjoy 12-hour days all year.

All of this got me wondering: how exactly will the changing days unfold?  Or, more precisely, when will days be shedding the most minutes of daylight?  This might be the time of year to exercise the most resiliency; sunlight will be slipping away the fastest!

Okay, so this problem is obviously going to involve a lot of geometry; particularly, trigonometry.  It’s almost impossible to solve without the use of some diagrams.  Before we go too far let’s define some variables.

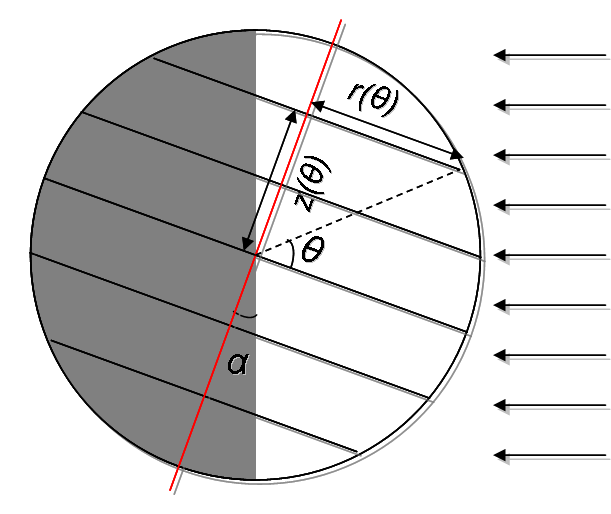
While the earth has a more or less constant inclination, depending on where it is in its orbit, it has an effective inclination relative to the sun that we’ll call \alpha .  At the equinoxes, \alpha is zero, whereas at the solstices, it is maximized at the value of earth’s inclination: \zeta=23.4^{\circ}.  Daylight also depends on your latitude, \theta , so I’ve included that, as well as dependent values z and r .

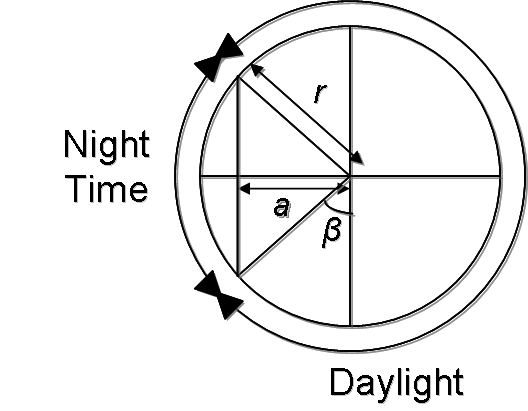
If we look at just the slice of earth at a relevant latitude, \theta , we can see some new values that will useful for solving our problem.

In this case, 2\beta will be the difference in degrees of Earth exposed to daylight from our baseline 180^{\circ}.  It can be determined as

\beta=sin^{-1}\left(\frac{a}{r}\right)

where

a=z\:tan\,\alpha,\;\;\; r=R\:cos\,\theta,\;\;\;z=R\:sin\theta

and R is the radius of the Earth.  Finally, we just need a last diagram to indicate the revolution of Earth around the sun.

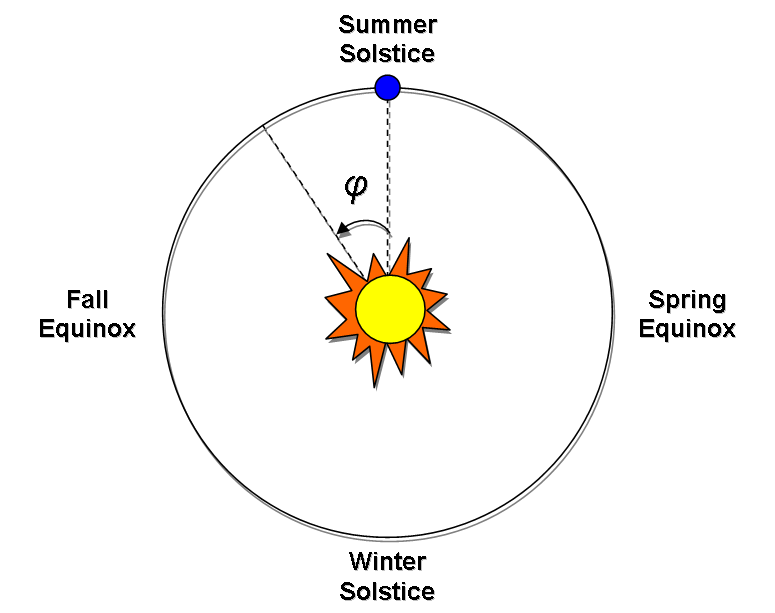
So, if \phi marks the Earth’s position as it revolves around the sun, with the northern hemisphere experiencing summer solstice at \phi=0, then we can say \alpha=\zeta\:cos\,\phi.  Substituting into our equation for \beta, we find

\beta=sin^{-1}\left[tan\,\theta\:tan\left(\zeta\:cos\,\phi\right)\right]

I think it’s pretty fair to say that the Earth is rotating at a constant rate, so if \pi+2\beta (we’re switching to radians!) is the angle spanned by sunlight, that means the daylight hours number:

24\;hrs \cdot\frac{\pi+2\beta}{2\pi}=12\;hrs \:\left(1+\frac{2\beta}{\pi}\right)

Plugging in for \beta should give us an expression for the number of daylight hours as a function of latitude \theta and time of year \phi:

12\;hrs \:\left(1+\frac{2}{\pi}\:sin^{-1}\left[tan\,\theta\:tan\left(\zeta\:cos\,\phi\right)\right]\right)

Now, if I had the stomach for it, I’d take the partial derivative of that expression with respect to \phi a couple of times, and set that equal to zero to find the maxima/minima of rate of change of sunlight.  Instead, I’ll graph this a couple which ways and try to draw some conclusions visually.

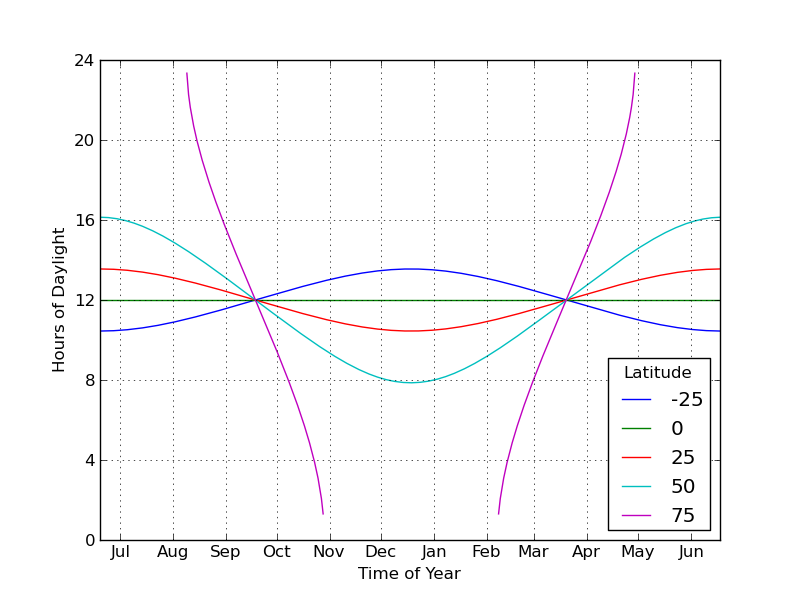
First, I’ll plot daylight hours versus time of year for several latitudes (including one in the southern hemisphere):

Notice how the purple curve disappears at the top and bottom; this is because the 75^\circ latitude is north of the arctic circle, resulting in continuous daylight and nightfall for parts of the year.  By inspection, most of the curves (the U.S. spans approximately from 25^\circ to 50^\circ north) have their maximum rate of change at the equinoxes, which kind of makes sense; that is the midway point between the two solstices.  The 75^\circ curve, while it has a steeper slope than the others at the equinox, appears to actually be a minimum for the second derivative; the slopes get steeper as one moves away.  I’m not entirely sure if I’m modeling that correctly, but it’s a pretty neat result.

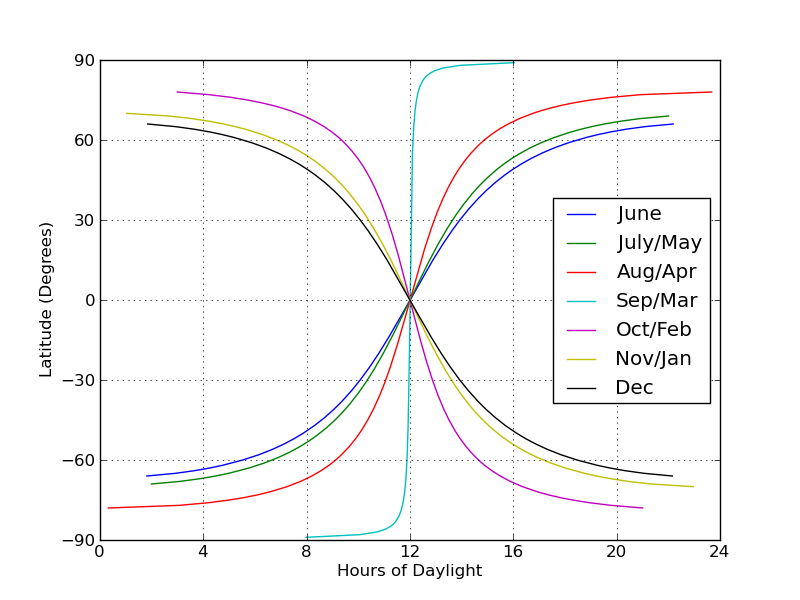
Next, I plotted daylight hours versus latitude for several times of year; I put latitude on the vertical axis, since, you know, latitude is vertical:

Not really as much to glean from this, as far as I can tell.  It’s pretty cool that you can see for any time of year, all of the curves come together so that at the equator, there is always 12 hours of daylight.

Note that I didn’t take into account the fact that the Earth does move around the sun a smidge during a given day.  I imagine that would slightly change the predicted sunrise/sunset times, but I’d also venture to say that the effect is quite small.