Summer’s end is drawing near, and that always leaves me a little bummed out. It’s not the temperatures I fear, it’s the waning daylight that really irks me. Obviously, at higher latitudes, summer days are quite long, but in an example of conservation of daylight, I guess, you pay for it with very short winter days. People on the equator should be more well-balanced, as they enjoy 12-hour days all year.
All of this got me wondering: how exactly will the changing days unfold? Or, more precisely, when will days be shedding the most minutes of daylight? This might be the time of year to exercise the most resiliency; sunlight will be slipping away the fastest!
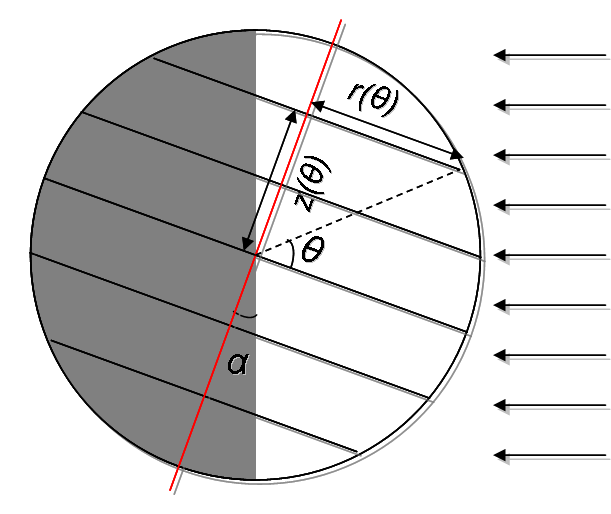
Okay, so this problem is obviously going to involve a lot of geometry; particularly, trigonometry. It’s almost impossible to solve without the use of some diagrams. Before we go too far let’s define some variables.
While the earth has a more or less constant inclination, depending on where it is in its orbit, it has an effective inclination relative to the sun that we’ll call . At the equinoxes,
is zero, whereas at the solstices, it is maximized at the value of earth’s inclination:
. Daylight also depends on your latitude,
, so I’ve included that, as well as dependent values
and
.
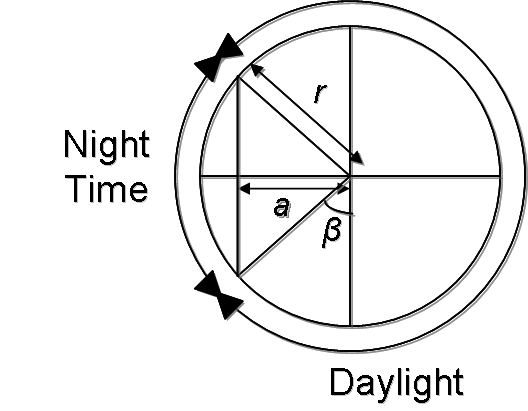
If we look at just the slice of earth at a relevant latitude, , we can see some new values that will useful for solving our problem.
In this case, will be the difference in degrees of Earth exposed to daylight from our baseline
. It can be determined as
where
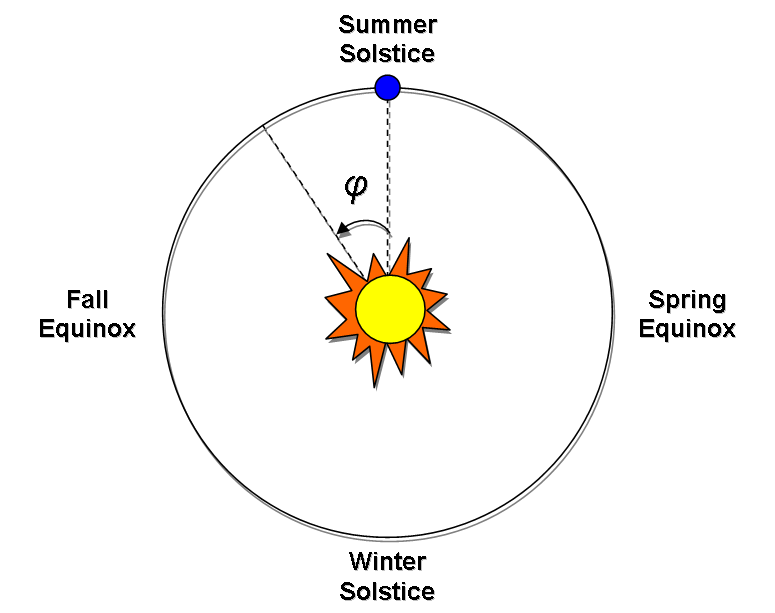
and is the radius of the Earth. Finally, we just need a last diagram to indicate the revolution of Earth around the sun.
So, if marks the Earth’s position as it revolves around the sun, with the northern hemisphere experiencing summer solstice at
, then we can say
. Substituting into our equation for
, we find
I think it’s pretty fair to say that the Earth is rotating at a constant rate, so if (we’re switching to radians!) is the angle spanned by sunlight, that means the daylight hours number:
Plugging in for should give us an expression for the number of daylight hours as a function of latitude
and time of year
:
Now, if I had the stomach for it, I’d take the partial derivative of that expression with respect to a couple of times, and set that equal to zero to find the maxima/minima of rate of change of sunlight. Instead, I’ll graph this a couple which ways and try to draw some conclusions visually.
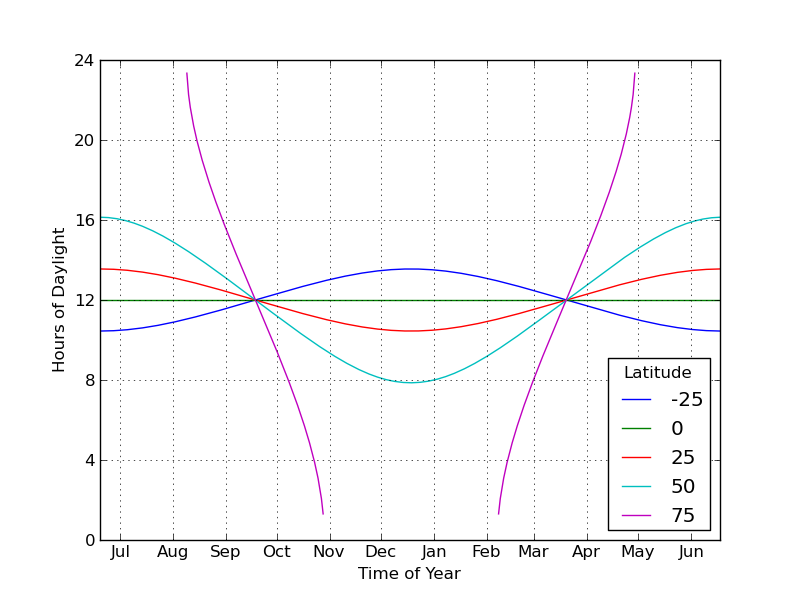
First, I’ll plot daylight hours versus time of year for several latitudes (including one in the southern hemisphere):
Notice how the purple curve disappears at the top and bottom; this is because the latitude is north of the arctic circle, resulting in continuous daylight and nightfall for parts of the year. By inspection, most of the curves (the U.S. spans approximately from
to
north) have their maximum rate of change at the equinoxes, which kind of makes sense; that is the midway point between the two solstices. The
curve, while it has a steeper slope than the others at the equinox, appears to actually be a minimum for the second derivative; the slopes get steeper as one moves away. I’m not entirely sure if I’m modeling that correctly, but it’s a pretty neat result.
Next, I plotted daylight hours versus latitude for several times of year; I put latitude on the vertical axis, since, you know, latitude is vertical:
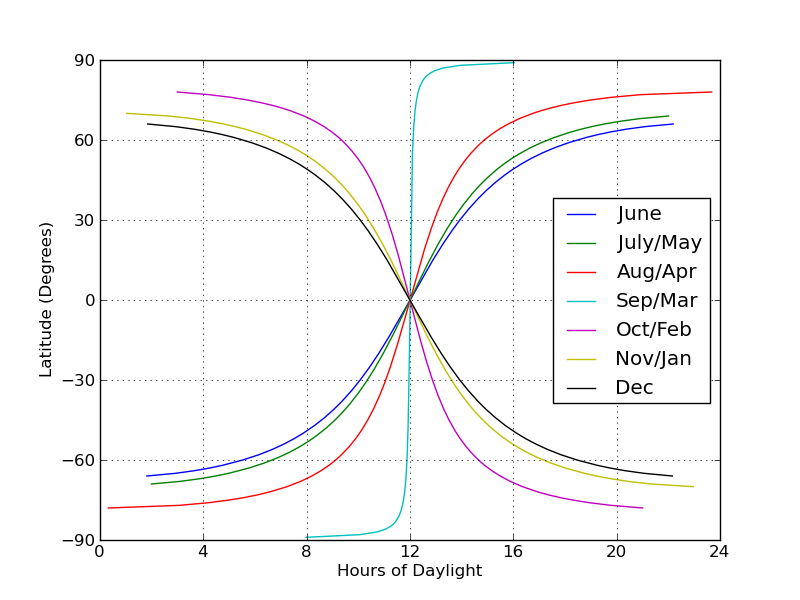 Not really as much to glean from this, as far as I can tell. It’s pretty cool that you can see for any time of year, all of the curves come together so that at the equator, there is always 12 hours of daylight.
Note that I didn’t take into account the fact that the Earth does move around the sun a smidge during a given day. I imagine that would slightly change the predicted sunrise/sunset times, but I’d also venture to say that the effect is quite small.

