My kids’ new favorite game is Outfoxed. Everyone works together to try to identify the fox guilty of stealing a pie. Sort of a mash up of Clue and Guess Who.
In order to make either of two moves (find a clue or reveal suspects), a player has to roll three dice and have them all come up “eyeballs” (for suspects) or “paw prints” (for clues) — each six-sided die has 3 of each, so 50/50 chance to roll either. You have to decide ahead of time which set of three you’re trying to roll, and you get three chances to get all three. After each roll, you can set aside any dice that are what you’re going for; subsequent rolls only involve the remaining dice.
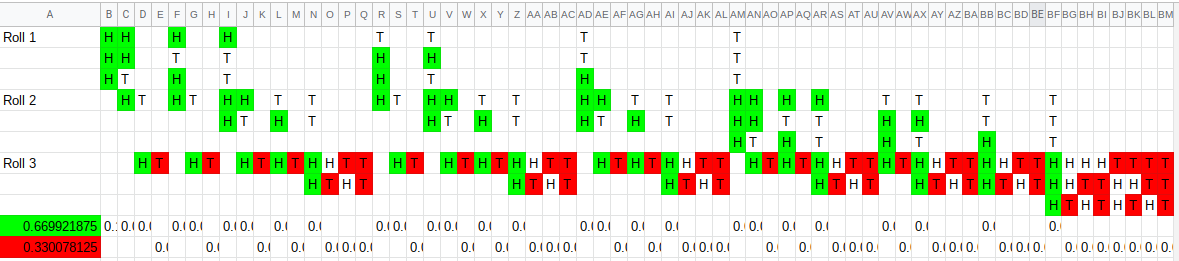
It wasn’t obvious to me at the outset how hard it would be to successfully roll, but after playing for a little bit, it was pretty clear that you were more likely to be successful than not. So I wanted to try to figure out how the odds were stacked. The rolling scheme is sufficiently complicated that I couldn’t figure out any sort of clever solution, but it’s not too complex that you can’t brute force all the possibilities. So that’s what I did:
So I broke out all the possible roll combinations and the associated likelihood for each (note, since we may roll anywhere from one to three times, each outcome is not equally likely). To check my math, I summed up all the probabilities and got unity, so I’m optimistic I did it right. The odds are that you’ll be successful on just a skosh more than 2 out of 3 turns (67%).
It never hurts to double check. So in addition to this sort of derived approach, I went for a Monte Carlo approach as well. It only took a little bit of python to confirm the numbers that I got previously. I also confirmed an additional little detail. When successful rolling paws for the purposes of finding clues, the average (mean, median, and mode!) number of paws is exactly 4 (note: 3 of the sides of each die have paws; 2 of the sides have a single paw and 1 side has two paws).
import random

random.seed(19)

die = [0, 0, 0, 1, 1, 2]

def roll(ndice):
 dice = []
 for i in range(ndice):
 dice.append(die[random.randint(0,5)])
 return dice

def get3():
 paws = 0
 ndice = 3
 for i in range(3):
 dice = roll(ndice)
 for i in range(ndice):
 if dice[i] > 0:
 paws = paws + dice[i]
 ndice = ndice - 1
 if ndice == 0:
 return paws
 return 0

nturns = 100000
success = 0.
fail = 0.
paws = 0.

for i in range(nturns):
 outcome = get3()
 if outcome == 0:
 fail = fail + 1
 else:
 success = success + 1
 paws = paws + outcome

print 'Success: ',success/nturns
print 'Failure: ',fail/nturns
print 'Avg. Paws: ',paws/success
That’s statistically better than guessing by a little bit. Adam Savage
This was Adam’s observation regarding people’s ability to identify the palms of their hands. In their experiment, 7 out of 12 people correctly identified their palm. I can only guess that Adam’s was implying that 6/12 would have been the result of “guessing”, but of course, since they had to pick their palm out of 10 palms, you’d expect the guessing rate to be 1/10 (or 1.2/12), so 7/12 is significantly better than guessing. People were truly able to identify their own palms to an extent.
As for identifying the backs of hands, the experiments were kind of problematic. To the best of my viewing ability, all of the “control” participants took the picture with the peg in between the index and middle finger. I did not see one exception to the rule; it looks like Adam was rigorous in producing consistent pictures. However, most, if not all of the 12 volunteers they brought in to identify the backs of their hands placed the peg between their ring and middle fingers. I really can’t fathom how
they let this happen
they didn’t notice that there was a problem
Now, that doesn’t mean that people are not better able to identify the backs of their hands, but I think it’s dangerous to conclude that after such a flawed experiment. Furthermore, after 10/12 people were able to identify their own teeth, I think out of such a small sample, that’s essentially the same rate of recognition as the (flawed) back of the hand tests, where 11/12 people identified the back of their hands. Maybe this is something they’ll tackle in an episode where they revisit old experiments…? On the other hand, this isn’t the sexiest of tests (there are no explosions or fires), so it might not merit a revisit.
Finally, let’s look at the glass-breaking needle. I don’t know who is in charge of calculating kinetic energy at Mythbusters, but they need to fire them. It seems to be the number they most consistently misrepresent. In this case, we are informed of the Mythbusters’ respective throwing abilities:
Kari: 28 mph
Grant: 38 mph
Tori: 47 mph
As Tori is about to try his hand at breaking the glass, the narrator tells us that his needle has 40% more kinetic energy. Based on the context, I assume he means 40% more than Grant, but I wouldn’t swear it. Anyway, if you take a ratio of two values, and the numerator is 40% greater than the denominator, the ratio will be 1.4. Let’s see here:
This of course corresponds to a 53% increase in kinetic energy. So once again, I have no idea how/why they’re calculating kinetic energy…
This is going to ruin Thanksgiving forever. Tori Bellacci
Lots of vacations and other distractions going on, so I’m going to try to catch up to the episodes I’ve missed, working backwards. We’re starting with their Thanksgiving special!
I think my favorite part of this episode was not exactly part of the episode. In between commercials for Megastorm and Sister Wives, Alton Brown explained how popcorn pops. Explaining that the kernels were “steam bombs”, he painted a clear and interesting picture of the popping process. It made me happy they included it and sad that it (and more like it) is not more thoroughly integrated into the episode. For instance, a similar explanation of why eating a lot makes you tired from the nutrition professor would be a welcome addition.
I wish I could give more examples, but often it seems like the Mythbusters are allergic to large sample sizes. When is the last time you’ve had identical scores on consecutive attempts at an arcade game? It would have been extremely easy to have them play a few times and take the average. I doubt the conclusions would have changed significantly, but they’d definitely have more of a case when they claim results are “conclusive”.
Now for my safety scolding on the heels of their cannon accident. It will make me sound like an old grumpy man, but I don’t care. I know they’re professionals and escorted by a police car, but I’d really like to see seat belts on the guys as they’re driving around with their Thanksgiving dinner. I hope/assume that they were wearing lap belts and the car was too old to have 3-seat belts.
It was great that they put thermocouples all over their car, and I loved the graphs. I would have preferred to show some thermographic images as well:
However, they added a bunch of insulation after looking at all the results. Wait, what?
For regions in equilibrium, the heat into a region equals heat out of the region. Easy to say mathematically:
In the case of cooking in the car, is the heat being generated by the relevant car part, and is being lost either by convection to the surrounding air or conduction to an adjacent part. For our purposes, the heat in is constant, but the heat out is proportional to the temperature difference between the region and its surroundings.
The relationship is dictated by a heat transfer coefficient (in this case , but sometimes ) based on the efficiency of either convection or conduction. By adding the insulation, this transfer is inhibited, and the coefficient is decreased. Thus, in order to maintain , must increase.
That’s a mathematical way of saying what intuition already tells us: insulation will make the cooking regions hotter. This is why I don’t understand why they didn’t add the insulation before measuring the temperature throughout the car. Fortunately, this mistake was mitigated by leaving the thermocouples in and monitoring the temperature while cooking the dinner.
Finally, a last thought. The episodes always begin with something to the effect of “Do not try any of the experiments you are about to see at home“. While I understand this is something lawyers make them put in there, I’d appreciate them going all Mr. Wizard and giving us a few things to do at home. With the exception of the Chinese popcorn cooker, I don’t see why most of the stuff couldn’t/shouldn’t be attempted at home. Okay, maybe it’s a bad idea to have people hanging turkey parts from underneath their car in traffic, but why not give the audience something to do? I understand they make their live show somewhat interactive…
My apologies in advance if you’ve never had the privilege to ride in a car with a sun roof at a high rate of speed. If you’ve been this fortunate, perhaps, because sun roofs can be quite noisy when traveling at high rates of speed, you’ve been in such a car during which the sun roof is closed while traveling at a high rate of speed. If not, I think closing a window while the car is moving fast can work equally well.
I bring this up, because it happened to me this weekend, and I noticed something quite interesting, which aroused the fluid dynamicist in me. My ears popped. Like changing elevation quickly, or closing your nose off while blowing out, the pressure in my ears changed. This caught me off guard, but it should not really come as a surprise.
Engineers use a similar principle to determine pressure drops in pipes, using an instrument called a manometer. It all starts with the Bernoulli equation: +\rho g z_2
Bear with me, but we’ll go ahead and ignore the effect of elevation in this case, leaving us:
A manometer can measure the static pressure of a flow (the p value in the above equation) with an opening perpendicular to the direction of flow. Oftentimes, whatever tube that’s perpendicular to the flow will have a column of liquid that will move up or down depending on the static pressure it is measuring.
Okay, so let’s call the car a giant manometer of sorts that takes on the static pressure of the air whooshing by the sun roof. Supposing the static pressure of the air rushing by is simply a single atmosphere (101 kPa), then if there was no other circulation in and out of the car, this is what the static pressure of the car would be (the caveat is that the geometry of the sun roof is probably not ideal for measuring the precise static pressure).
Well, if the car were perfectly sealed, and the sun roof could close very, very fast, the pressure would not change. However, the car is certainly not immune from the influences of the outside air, even with the sun roof close. I’m going to assume that with all the windows closed and the A/C off, the inside of the car will equilibrate to the stagnation pressure:
That doesn’t seem like a huge difference, but it’s likely sufficient for your ears to pick up on. If the A/C was on high or there was a giant hole in your windshield, the car would probably maintain a pressure of 101.4 kPa. But suppose the forces driving the pressure of the car down to 101 kPa through the sun roof are more powerful than the ventilation leaks that would tend to move the needle to 101.4 kPa. Then the act of closing the sun roof will quickly (depending on how “leaky” the car is) shift the pressure up to 101.4 kPa, causing your ears to pop!
My intention was to come up with a cleaner description for this effect than I managed to churn out. My apologies for making a mess of it, and I’m open to suggestions on how to tighten up the explanation… but it’s a simple enough experiment to try it out for yourself!
I am posting to make a brief return from my hiatus. The reasons for my recent dry-spell have been many-fold. In addition to scholarly deadlines and much-appreciated vacation, I had my DVR die, which had some back episodes of Mythbusters I had been meaning to get to.
Not to mention the fact that I’ve been reading XKCD’s awesome “What If” blog: http://what-if.xkcd.com/. Aside from being distracting, it has been discouraging instead of inspiring to read such good posts. I’d love to have thought of it.
To distract me, I spent some time admiring other people on YouTube; specifically two of my favorite personalities:
A pretty good swath of the U.S. was exposed to an annular (as opposed to total) solar eclipse yesterday afternoon, and an even wider swath experienced a pretty significant partial solar eclipse. But experienced is a relative term. What if the weather doesn’t cooperate?
Certain parts of the great northwest are famously known for their cloudy days. Unfortunately, I live in one of those places, and the weather was especially uncooperative. In fact, if I didn’t know what the direction the sun was supposed to be, I couldn’t have picked it out by looking at the overcast sky. Though I think I perceived it getting darker, but if I hadn’t known there was an eclipse, I probably would have chalked it up to dark clouds.
So how to best experience the eclipse? Clouds may be translucent to visible light, but they are transparent to radio waves. I’m lucky enough to have access to a radio telescope with a group of like-minded astronomy aficionados, and by pointing it at the sun, observing at 1420 MHz, we were able to observe the effect of the eclipse despite the dour weather. Both the duration, and the degree of obfuscation matched predicted characteristics of the optical eclipse.
I’m sorry I don’t have the time/talents to get the units on the graph better, but you can trust me that the minimum of the power graph corresponded to the reported time of maximum eclipse. In our area, we expected ~75% blockage, so the magnitude of changes in power we observed correlated pretty satisfyingly. Our data, of course, does not consist of an image of the eclipse; instead, it is a single, time dependent value of power is recorded of an area of the sky that includes the sun.
Why can’t we get better than one-pixel resolution? A lot of it has to do with the frequency of radio waves. They have wavelengths on the order of meters (visible light is on the order of a micrometer). Without expounding too much on principles of electromagnetic radiation, know that it is much easier to achieve higher resolution with a smaller aperture at smaller wavelengths.
The Earth’s atmosphere (and magnetic field) is fairly complex, and blocks a lot of types of radiation from space (which is good for our health, but bad for astronomy). This is why certain types of telescopes have to go into space, because the wavelengths they’re meant to observe do not are not observable from the ground. But while the atmosphere is more opaque to many more frequencies than we realize, it is interesting to note that it is more transparent to some waves (e.g. radio) than you might not otherwise suspect.
I was pretty excited that both pieces of this episode actually involved some physics, as opposed to the regrettable (on so many levels) Battle of the Sexes episode. However, I knew I would have to go to work on this post as soon as Jamie and Adam started equating speed and energy.
They were interested in how a bullet ricochets off of asphalt when fired at different angles. At a shallow firing angle (16 degrees), they noted that the velocity decreased from 1200 fps to 962 fps. This is not a huge decrease in speed, but knowing that energy is proportional to the square of velocity, I was not willing to say that it was “not a lot of loss”. In fact, for a bullet mass , we can calculate the two energies, before and after impact (note that when you multiple by mass, you get units of energy):
In other words, the energy decreases to 64% of the original value (less than the 75% that Adam later quoted). Losing more than a third of the energy doesn’t seem like something so easily dismissed. So I was suspicious our heroes were confusing momentum with energy, and forgetting to square the velocity.
The misconception was cemented by Adam when they moved on to the steeper shot at 32 degrees. In that case, the velocity dropped from 1200 to 475 fps. Adam said that this had “lost almost two-thirds of its energy”, but now we know better:
It lost 84% of it’s energy! Quite a bit of energy to give up during a ricochet!
So while it might seem like nit-picking (and to an extent, it is), there is really an important point here that energy is not linearly related to velocity but to the square of velocity. This is a concept that is important to keep in mind; energies tend to fluctuate greatly as velocities change, and large velocities result in very large energies.
I just wanted to chime in on the other myth of the blast-aided jump. I thought they did a pretty good job with this; the nitrogen gun was impressively consistent and the high-speed video was fantastic. They barely touched on this concept of pressure versus impulse, but going to the anfo was definitely a step in that direction.
Anywho, pressure waves have two important components. One is the increase from atmospheric pressure, and the other is the duration. The time integral of the over the duration of the blast (times the area of the target) is called the impulse. While a large can do damage to a human body, essentially jostling adjacent cells apart from each other, in order to really do damage to object and throw things around, you need a big impulse, delivered, which means the pressure and time need to conspire to impart a lot of momentum. Hence the slow exploding anfo.
I admit, I was also disappointed, if not surprised, that Buster didn’t get pushed a whole lot. They sort of addressed my concern about a small exposed area (over which to integrate said ) by attaching their bed-liner sail. I guess I’ll just go watch The Avengers to satiate my appetite for unrealistic explosions.
Now that I had established the mis-calibration of my oven, I wanted to characterize it so that I can dial it in to achieve a desired temperature. I know that it’s easier to raise the temperature than to wait for the temperature to dissipate, so my plan was to start at a low temperature (200 ) and periodically (approx. every 20 minutes) increase it by 25 degrees at a time. Below are the results:
A couple of neat points until I get to the heart of the matter. Notice how the frequency of the temperature control increases at higher temperatures. Remember, I had established that the cooling off of the oven occurs similar to exponential decay. The result is that it cools off relatively fast (deg/min) at higher temperatures, and slower at lower temperatures, because the temperature difference with its surroundings is higher at the higher temperatures. So, because it’s cooling off faster at higher temperatures, the heating element has to turn on more often, causing the temperature to fluctuate much faster. In fact, at the lower temperatures, I didn’t even get a full cycle over which to average during the 20 minute duration.
So I pick up the temperature correlation at 275 . My initial inclination was to just take the average value between each period’s peak and trough, but because the curve is not regular (it cools off slower than it heats up), this would bias the temperature higher than what the time averaged temperature actually is. So I took the time to actually time average each curve segment between peaks (or multiple peaks if available). The following is those results as well as a linear curve fit:
In a perfect world, where the oven works like it’s supposed to, the best fit line would have a slope of 1.0 and an intercept of zero, i.e. , i.e. what you dial up on the oven is what the temperature actually is. Unfortunately, both values differ from their ideal. So, not only is there an offset between dialed and measured temperatures, but moving the dial by a degree results in 1.06 degree change in the oven temperature. As a result, the oven is off more at higher temperatures. For example, when the dial reads 300, the oven is at 336 ; 36 degrees off. But when the dial is at 500, the oven is at 548 ; 48 degrees off.
I don’t think I’ll be wanting to run that calculation every time something needs cooking. I’ll probably pick a “best” offset value of, say, 40 degrees and hope that the recipes can tolerate a difference of 10 degrees or less.
I knew that thermocouple that I bought with no solid plans for using would come in handy some day…
I’ve got a new place with a new oven that has been consistently over-cooking my food. I could call the super, or turn the oven down or cook everything for less time, but none of that gives me an excuse to bust out my Arduino. Fortunately, I already had a (K-type) thermocouple and MAX6675 amplifier on hand that have been looking to add purpose to their lives. Using a handy Arduino library for the MAX6675 made life and coding really straight-forward.
My original intention was to simply display the oven temperature on an LCD and take readings at several oven temperature settings. I’m glad I decided to be a little more rigorous and actually record the serial data that was sent to my computer (one data point per second). As it turns out, the temperature fluctuated over a wide range, so the data records were handy. Not only was there a wide range of temperatures, but they were consistently higher than the oven setting of 400 .
This is the data taken after turning the oven on. You’ll notice a couple of things. First, the temperature oscillates pretty regularly. As far as I can tell, the heating element goes from all on to all off, contributing to the bouncing around. Also, the magnitude of the fluctuations made me suspicious that I was getting a bit of a misleading reading due to the radiation coming off of the heating element. I’d rather not expound on this too much in this post, but try holding your hand in front of your face when next to a fire. You will immediately feel cooler; most of the heat you from a fire (an outdoor one, anyway), is radiative. This temperature does not reflect the air temperature; this is why you put a thermometer in the shade.
Anyway, I thought this might be contributing to an elevated temperature reading, so I put a piece of aluminum foil between the thermocouple and the heating element at the bottom of the oven. The foil was intended to block the radiation from the red hot heating element. I tend to believe this worked; it’s not as if the foil got red hot (~1500 ), but obviously, it made little to no difference in the temperature reading. So either this radiative heating was never or factor, or I am making a mistake.
After 35 minutes, I turned the oven off, just to see how it cooled off:
This looked like something that maybe I could model… In fact, recalling some of my heat transfer book-learnin’, I figured the best way to start would be to treat the oven as a lumped capacitance system (insert spherical cow joke here). I didn’t have my old textbook on hand, so I fell back on Wikipedia, which provided me with a nice equation for the expected exponential decay:
A characteristic time of 0.00045 seemed to do a nice job of matching the theory to the model:
Not bad.
I did these tests two different days; I was actually shocked at how consistent the temperature histories are! The oven may be wrong, but it’s wrong consistently, which means I should be able to learn to use it without burning everything. I guess a potential next test would be to do this analysis at various oven setting and observe what the results are so that I have a consistent adjustment to cook my food appropriately.
At the end of the day, I’m wondering what my oven is doing wrong. Is the feedback (a thermocouple, I presume) mis-calibrated (assuming mine is accurate…)? Where is it placed? Perhaps it’s measuring temperature in a location not particularly relevant to the oven center. Questions for another day…
[He] knows everything there is to know about mechanics… Adam Savage
What prompts Adam to say this? As far as I can tell, Charles Haine is a film director with little to know science/engineering training…
I’m not sure what I think of this show, Unchained Reaction, yet. I like the idea; it reminds me of Junkyard Wars, which I loved. I’m trying to convince myself not to record the show and skip everything but the completed runs at the end. I haven’t done it yet, but I’m tempted.
Anyway, I watched the “Speed” themed episode and there was one big cringe-inducing moment near the beginning of the show that I had to follow-up on here. I spent a whole week teaching kids about this very principal in physics lab, so I figured I’d take a post to rant on a simple physics concept.
In the first challenge, teams have to complete the first link in their chain. The special effects team (“Monster Crew”) wanted to race a tortoise and hare, and to get them started, they were using counterweights to pull the animals across a table. The falling counterweights pulled ropes connected to the animals.
I think Adam and Jamie’s consultant, Charles Haine, over-thought it a little bit, and in an effort to appear useful and lecture to the team, he sort of threw up all over himself. After looking up his credentials (or lack thereof), I’m not nearly as surprised about what transpired…
He opened his misguided lecture with the following: “You know that two objects of different weights fall at the same speed if they have the same aerodynamic resistance, right?”
This is not a good start. We all learned that with no air resistance, objects subjected to the same gravitational field with accelerate at the same rate. But once any significant air resistance is introduced, objects fall at different rates depending on their weight, size, shape, etc. I’m not even sure what he meant by aerodynamic resistance (drag coefficient, aerodynamic drag force?), but either way, he’s wrong.
The team explains to him that the different speeds will be due to the different weights of the tortoise and the hare. Charles seems to go along a little bit: “More drag on the system by having a heavier weighted base will probably create enough for you.” Which isn’t necessarily patently wrong, but he’s not really being helpful, either.
See, to begin with, the hare wasn’t being pulled quickly enough. As a planned fix, one of the special effects guys (who isn’t dubbed an “expect in all things mechanical”) sensibly proposes to use a heavier counterweight (i.e. more potatoes).
Charles counters: “Remember, extra weight’s not going to fall any faster.” Argh! C’mon, your job is to help them. This is patently wrong, so it is really less helpful than not saying anything at all.
Let’s begin by looking at free body diagrams of each falling weight (sack of potatoes). For simplicity, I’ll just set one mass to double the other. Also, we’ll ignore friction and aerodynamic drag (which, if anything, helps Charles’ case) to keep things simple; rest assured, whether or not we make these assumptions, Charles is still wrong.
We know how gravity is acting on the two potato bags, producing a force of just mass times gravitational acceleration. What we don’t quite know is what the tension they’re experiencing is. So let’s look at the rabbit and the hare to try and figure it out:
All right, the normal force from the table definitely cancels out the weight of the block. But we still don’t know what either tension is. Although, if we assume a perfect (or near-perfect) pulley, we can say that the tension is constant throughout the rope, so that each pair of blocks experiences the same tension force (either or ).
So let’s first look at the left-hand situation. We have two equations:
(in horizontal dir. for the block on the table) (in vertical dir. for the hanging block)
Notice I use the same acceleration, in both equations; since the blocks are connected by a rope (without slack or elasticity), we can assume they accelerate at the same rate. So that’s two equations and two unknowns ( and ). We can work with that!
With some simple algebra, we can find . Following the same procedure with the heavier sack of potatoes, we discover . For those of you keeping score at home, ; in other words, the heavier sack of potatoes (and whatever is connected to it) will accelerate more quickly.
What’s happening, in words, is that due to the rope, you’ve essentially got a single mass moving/accelerating here; however, gravity is only able to accelerate a fraction of it. So as the suspended mass becomes a larger fraction of the total mass, the acceleration of the system will increase, ever approaching the maximum value of .
Fortunately, one of the team members doesn’t just take his words at face value, and while he can’t really put into words why he’s right about his idea for extra potatoes, I believe his intuition served him well. Sure enough, in the final cut, they got the hare to zip along the table.
I think a working knowledge of physics is a great thing to have, but it should be used in conjunction with intuition and common sense. I’m not saying that this world isn’t full of non-intuitive (but explainable) behaviors, but when you perceive the physics of the problem (as you understand them) to fly in the face of common sense, that’s a sign to take a step back and really think through what’s going on.
The topic sort of invites confusion, which is why it was in the physics lab: so it could challenge students’ grasp of the concepts. The difference is that Charles is not an undergrad; he’s on the show as an expert.
Okay, that’s fine, we all make mistakes, and he probably wishes he could have that back. But therein lies my problem with it. This isn’t live T.V. How does all of that make it past the editing process? At the very least, mix in a studio voice-over to correct the misinformation.
I’d say that they should bring me on instead, but I’m guessing Unchained Reaction won’t make it to season two…

^2}{(38\;mph)^2}=1.53")


 is the heat being generated by the relevant car part, and
  is being lost either by convection to the surrounding air or conduction to an adjacent part. For our purposes, the heat in is constant, but the heat out is proportional to the temperature difference between the region and its surroundings.
")
 , but sometimes
  ) based on the efficiency of either convection or conduction. By adding the insulation, this transfer is inhibited, and the coefficient is decreased. Thus, in order to maintain
  ,
,  must increase.


(24.6\; m/s)^2=101.4\; kPa")


 , we can calculate the two energies, before and after impact (note that when you multiple
 ^2") by mass, you get units of energy):
by mass, you get units of energy):^2=720,000M\: (fps)^2")
^2=462,700M\: (fps)^2")
^2=112,800M\: (fps)^2")
 increase from atmospheric pressure, and the other is the duration. The time integral of the
  ) and periodically (approx. every 20 minutes) increase it by 25 degrees at a time. Below are the results:

=x") , i.e. what you dial up on the oven is what the temperature actually is. Unfortunately, both values differ from their ideal. So, not only is there an offset between dialed and measured temperatures, but moving the dial by a degree results in 1.06 degree change in the oven temperature. As a result, the oven is off more at higher temperatures. For example, when the dial reads 300, the oven is at 336
, i.e. what you dial up on the oven is what the temperature actually is. Unfortunately, both values differ from their ideal. So, not only is there an offset between dialed and measured temperatures, but moving the dial by a degree results in 1.06 degree change in the oven temperature. As a result, the oven is off more at higher temperatures. For example, when the dial reads 300, the oven is at 336  .
.


=T_{env} + (T_0 - T_{env})\exp^{-rt}")
 seemed to do a nice job of matching the theory to the model:


 or
or  ).
). (in horizontal dir. for the block on the table)
 (in vertical dir. for the hanging block)
 in both equations; since the blocks are connected by a rope (without slack or elasticity), we can assume they accelerate at the same rate. So that’s two equations and two unknowns (
 . Following the same procedure with the heavier sack of potatoes, we discover
  . For those of you keeping score at home,
  ; in other words, the heavier sack of potatoes (and whatever is connected to it) will accelerate more quickly.
 .
.